 Arabic
  English
Vertex International University has announced free registration for a specialized training course titled “Using Artificial Intelligence Tools in Data Analysis and Business Intelligence Using Power BI,” delivered by Dr. Mohamed Badawy Farid, an expert in the application of artificial intelligence in academic environments. The course is part of the university’s training programs focused on developing practical skills related to the use of digital technologies in academic and professional fields.
The course explores the relationship between data analysis, business intelligence, and artificial intelligence, with a focus on tools that enable raw data to be transformed into readable and analyzable information, and then presented through indicators and dashboards that help understand performance and support decision-making.
From Raw Data to Actionable Information
Organizations continuously generate large volumes of data, whether related to sales, human resources, operations, financial performance, services, or educational activities. However, the existence of data alone does not create real value unless it is processed, organized, and analyzed in ways that help identify patterns and understand results.
One of the key challenges is moving beyond simply displaying figures to understanding what those figures actually mean. A single file may contain thousands of records, but its real managerial value emerges when trends can be identified, performance can be compared, strengths and weaknesses can be detected, and key performance indicators can be monitored.
This is where business intelligence tools become important, as they help organize and visually present data, making it possible to interpret large amounts of information through interactive dashboards and clear indicators.
When Data Analysis Becomes Part of Decision-Making
Data analysis is no longer limited to specialists in programming or statistics. The development of business intelligence tools has made a wide range of analytical capabilities available to professionals working in management, business, education, research, and other fields.
Power BI is among the leading tools used to build interactive reports and dashboards. It enables users to work with different data sources, organize and analyze information, and then present the results visually in ways that help users monitor indicators and identify relationships between variables.
With the integration of artificial intelligence into this field, data analysis has gained additional capabilities. Intelligent tools can assist in interpreting results, identifying patterns, preparing summaries, and generating preliminary insights that users can review and incorporate into their own analysis.
For this reason, the course focuses on combining data analysis and business intelligence tools with artificial intelligence applications, rather than treating each tool as an isolated skill.
Training Course Details
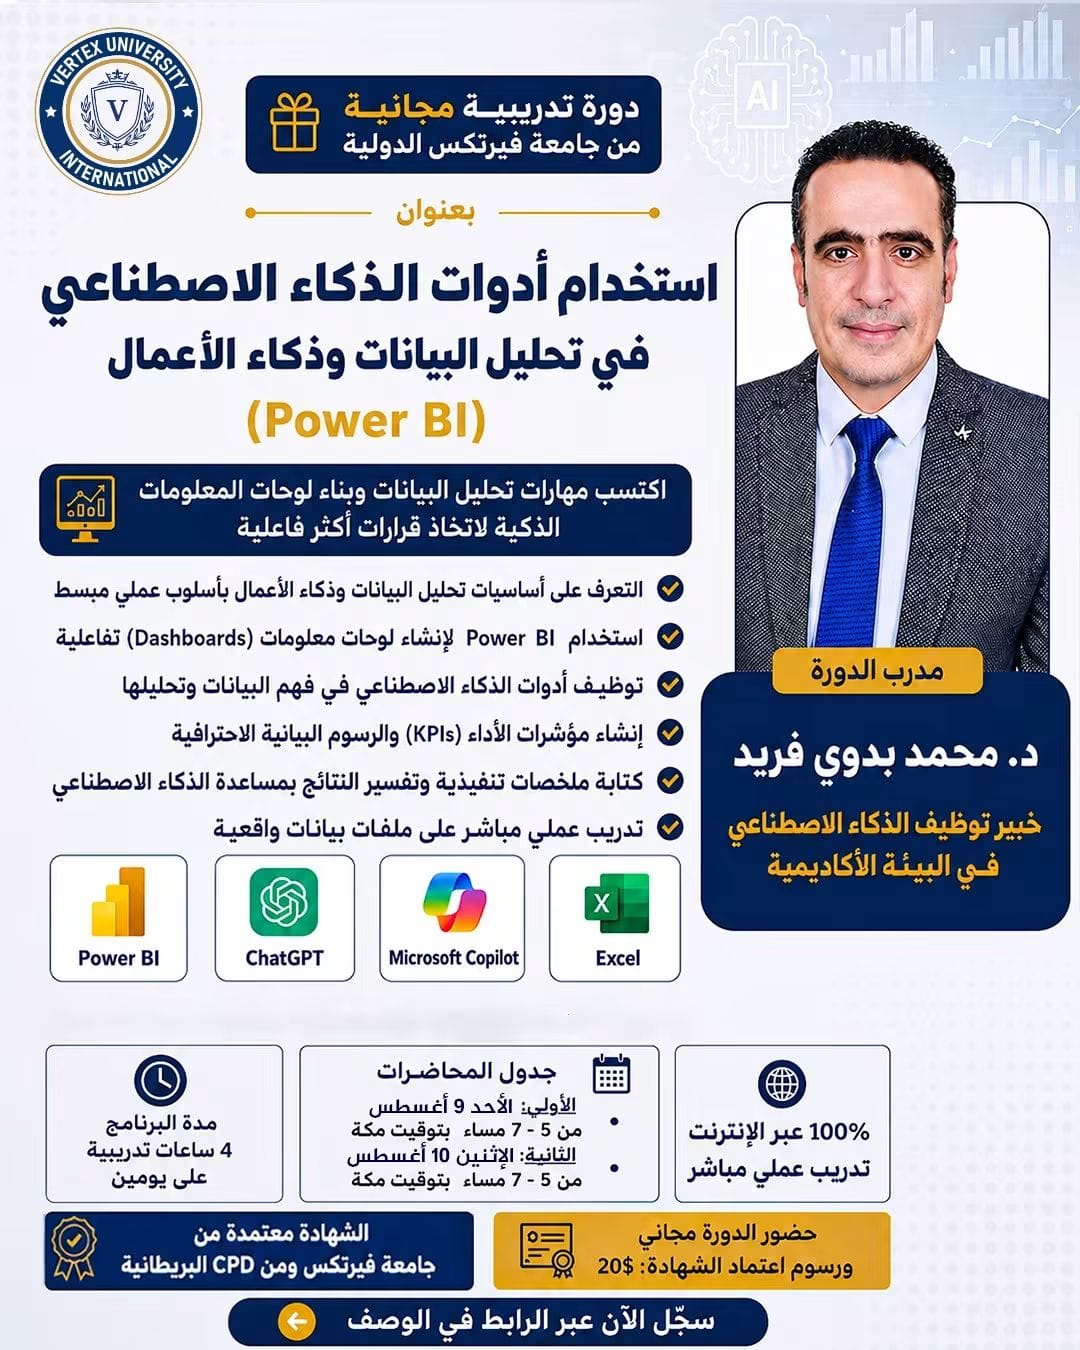
Course Title: Using Artificial Intelligence Tools in Data Analysis and Business Intelligence Using Power BI
Course Instructor: Dr. Mohamed Badawy Farid, Expert in the Application of Artificial Intelligence in Academic Environments
Course Dates: Sunday, August 9, and Monday, August 10, 2026
Number of Sessions: Two live interactive sessions
Duration: 4 training hours
Session Times: 5:00–7:00 PM Mecca Time
Study Format: 100% online
Target Audience: Individuals interested in data analysis and business intelligence, students, researchers, and professionals working in administrative, academic, and professional fields
Fees: Free
Certificate: Certificate accredited by Vertex International University and British CPD
Turning Data into Interactive Dashboards
One of the course’s core areas focuses on using Power BI to build interactive dashboards as a practical means of presenting data and monitoring indicators more clearly.
Participants receive practical training on working with data files and transforming them into visual reports containing charts, indicators, tables, and interactive elements, allowing results to be examined from different perspectives.
The objective is not limited to learning how to technically create a dashboard. It also extends to understanding how to select appropriate indicators and organize information in a way that makes the report more useful to its intended users.
An effective dashboard is not defined by the number of charts and visual elements it contains, but by its ability to answer the questions that managers, researchers, or analysts need to address.
Key Performance Indicators and the Role of Charts in Understanding Results
Key Performance Indicators (KPIs) are important tools for monitoring organizational performance because they help translate broader objectives into measurable indicators that can be tracked and compared over time.
The course therefore addresses how to create performance indicators and display them within dashboards, in addition to using appropriate charts to represent data in ways that make trends and differences easier to identify.
Participants also learn about the importance of selecting visual formats that correspond to the nature of the data, distinguishing between information that requires comparison and information that requires monitoring over time, as well as other situations that call for different approaches to data presentation.
The practical component also involves working with actual data and applying the tools to it, allowing participants to move from basic concepts toward developing analytical outputs that can be used in practice.
Artificial Intelligence in Data Analysis
Artificial intelligence has introduced new capabilities into different stages of data analysis. It can be used to assist in understanding datasets, identifying patterns, interpreting certain results, and suggesting ways to present information.
The course explores the use of several AI tools in this context, including ChatGPT and Microsoft Copilot, alongside Power BI and Excel.
Participants learn how to formulate prompts and instructions that help intelligent tools work with data more effectively, while recognizing that the outputs generated by these tools require human review and an understanding of the context in which the data was produced.
This integration can reduce the time required for certain stages of the workflow, particularly tasks related to exploring data, interpreting findings, and preparing preliminary summaries.
From Analysis to the Executive Summary
Data analysis does not end with the production of charts or the extraction of indicators. Results also need to be interpreted clearly so that they can be presented to management or relevant stakeholders.
For this reason, the course includes a component on preparing executive summaries and interpreting findings with the assistance of artificial intelligence tools. This enables participants to move from a collection of figures and indicators to concise summaries that explain the most important findings and the implications that can be drawn from them.
This aspect is particularly important in environments where decision-makers deal with large amounts of information and need to quickly identify the points most relevant to decision-making.
The training also helps participants distinguish between presenting data and interpreting it. A chart can show what happened, while decision-making requires an understanding of why it happened and what it may mean for the organization.
Practical Training Using Multiple Tools
The course is based on direct application through working with real-world data files rather than relying solely on theoretical explanations.
The training includes a range of tools that can be integrated at different stages of the data analysis process, including:
- Power BI for building dashboards and interactive reports.
- Excel for working with, organizing, and preparing data for analysis.
- ChatGPT for assisting with information analysis, interpretation of results, and preparation of summaries.
- Microsoft Copilot for leveraging AI capabilities in data-related tasks and productivity.
This approach gives participants an opportunity to understand how different tools can work together rather than learning each application in isolation, while emphasizing the selection of the appropriate tool according to the task being performed.
Learning Outcomes
By the end of the course, participants are expected to be able to:
- Understand the fundamental principles of data analysis and business intelligence.
- Recognize the role of artificial intelligence in data analysis.
- Use Power BI to create interactive dashboards.
- Develop key performance indicators and present them clearly.
- Create charts that support data interpretation and help identify trends.
- Use artificial intelligence tools to assist in interpreting data.
- Prepare executive summaries based on analytical findings.
- Work with real-world data files and apply analytical tools to them.
- Integrate Power BI, Excel, and artificial intelligence tools into a connected workflow.
- Select the appropriate tool according to the nature of the analytical task.
A Course Combining Data Analysis, Artificial Intelligence, and Business Intelligence
This course reflects Vertex International University’s approach to offering training programs focused on skills that can be applied directly in academic and professional settings.
Working with data has become part of many professions and fields, while artificial intelligence is introducing new capabilities across the stages of collecting, analyzing, interpreting, and presenting information.
By combining Power BI, artificial intelligence tools, and Excel, the course provides a practical framework for building an integrated process that begins with data and ends with organized information that can be used in reports, presentations, and decision-making.
The emphasis on real-world files and datasets also gives participants an opportunity to work with situations that are closer to actual professional practice, making the training experience based on application rather than theoretical knowledge alone.
- Accredited Certificate
Participants in the course receive a certificate accredited by Vertex International University and British CPD, documenting their participation in the training program and its training hours.
The certificate forms part of the program alongside its practical content and live training, providing participants with documented recognition of their participation in a specialized course in data analysis and business intelligence using artificial intelligence tools.
- How to Register
Vertex International University has opened free registration for the course “Using Artificial Intelligence Tools in Data Analysis and Business Intelligence Using Power BI,” which is delivered online through two live interactive sessions on Sunday, August 9, and Monday, August 10, 2026, from 5:00 to 7:00 PM Mecca Time, through the university’s training programs page:
Vertex International University Training Programs Registration Page